|
| Screenshots |
Microsoft Excel and the VisuLab Window:

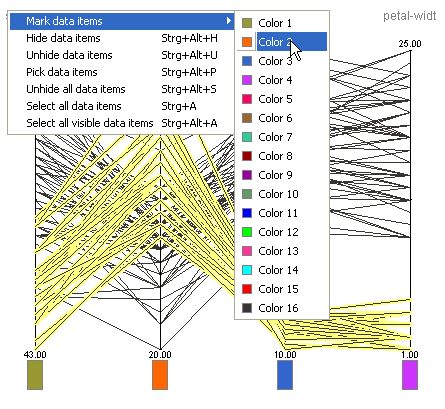
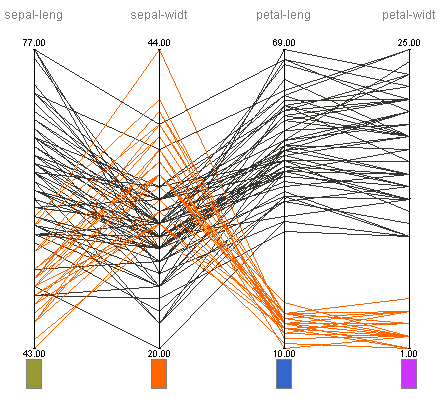
Visualisation with Parallel Coordinates. Shows how to mark data items by creating a selection with the mouse and choosing a marker color in the context menu:


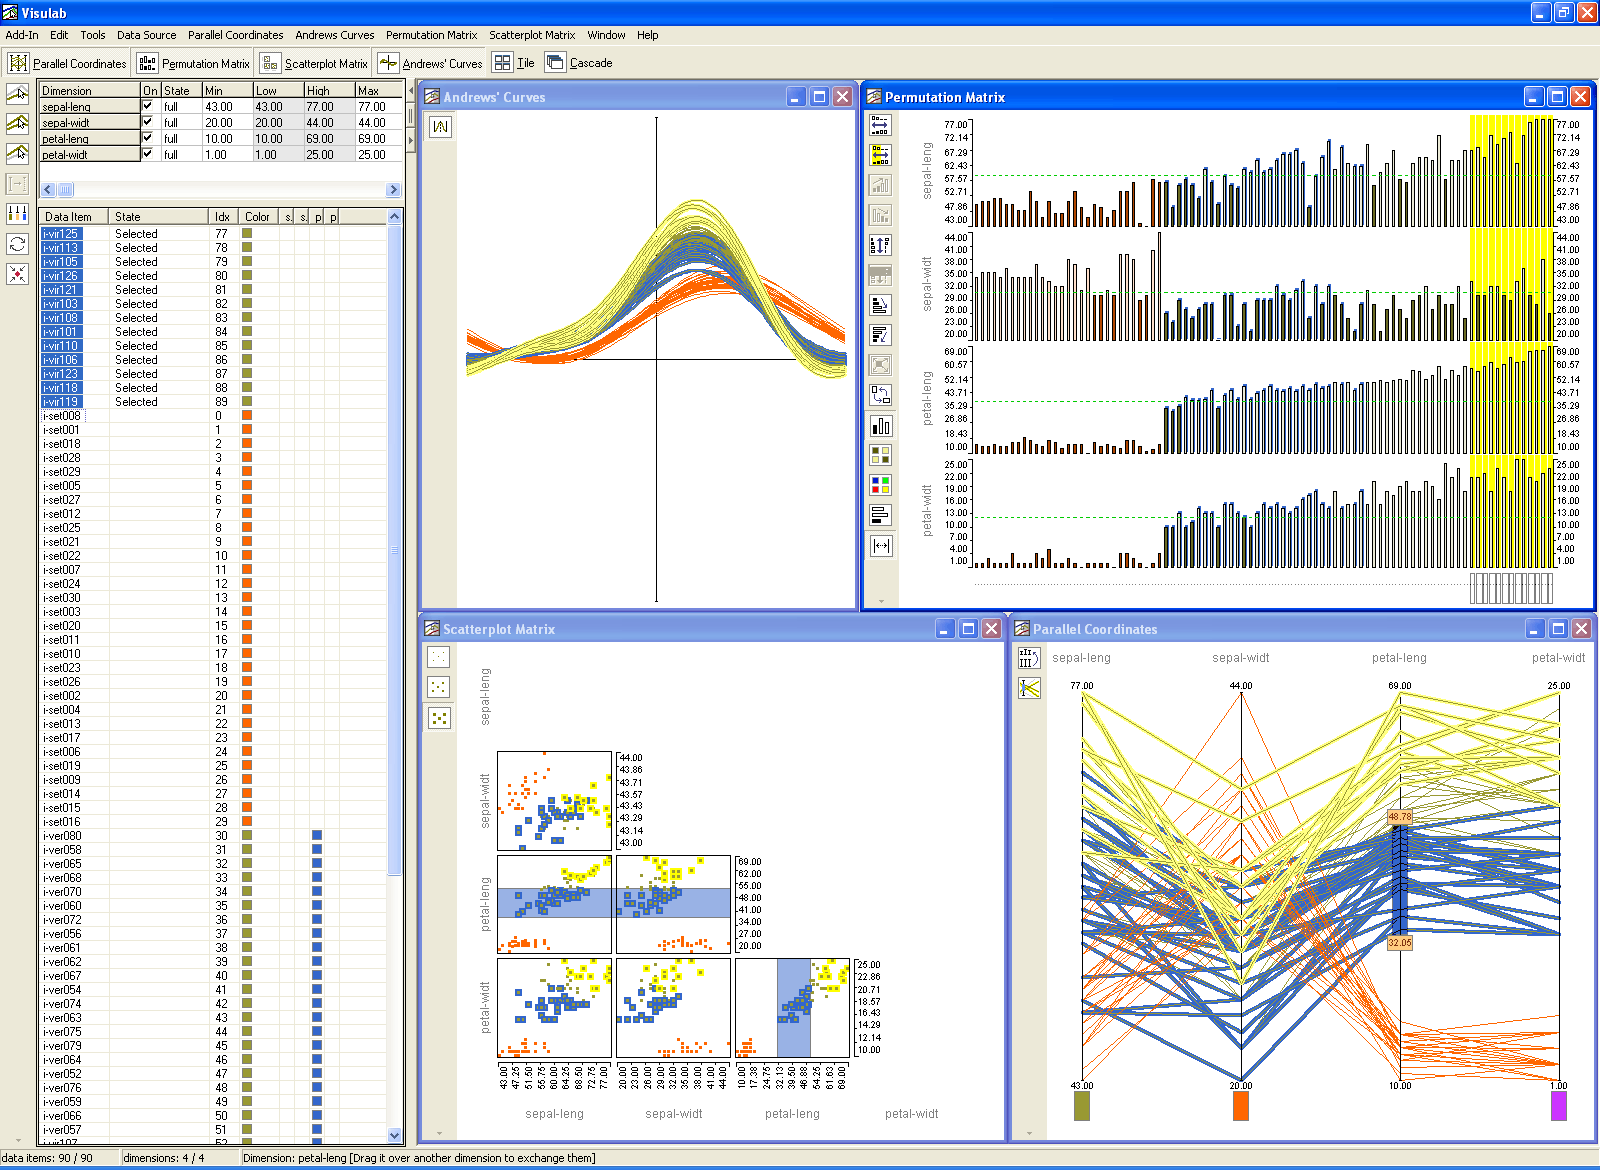
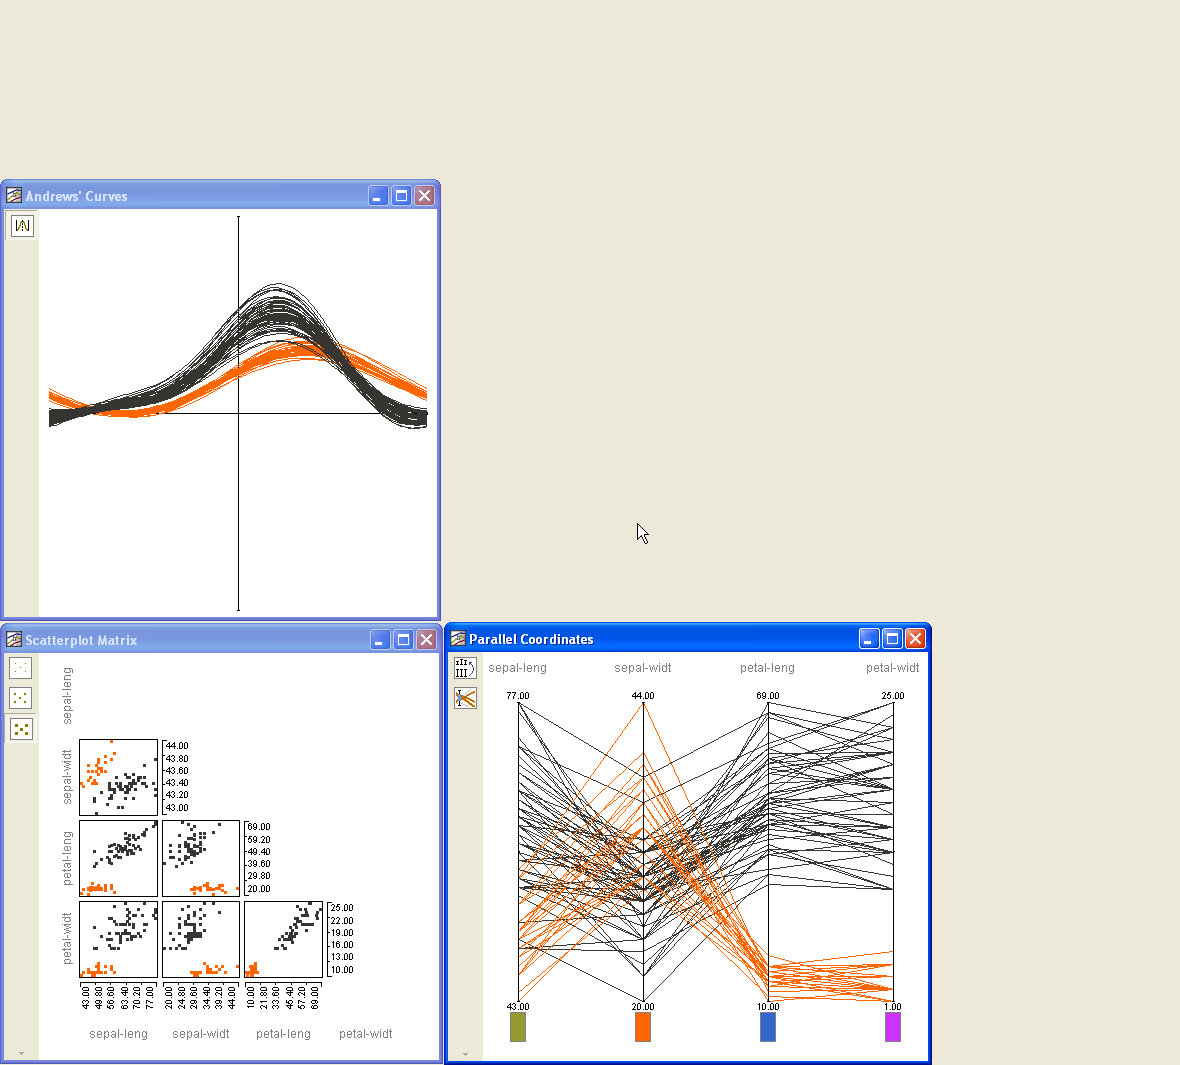
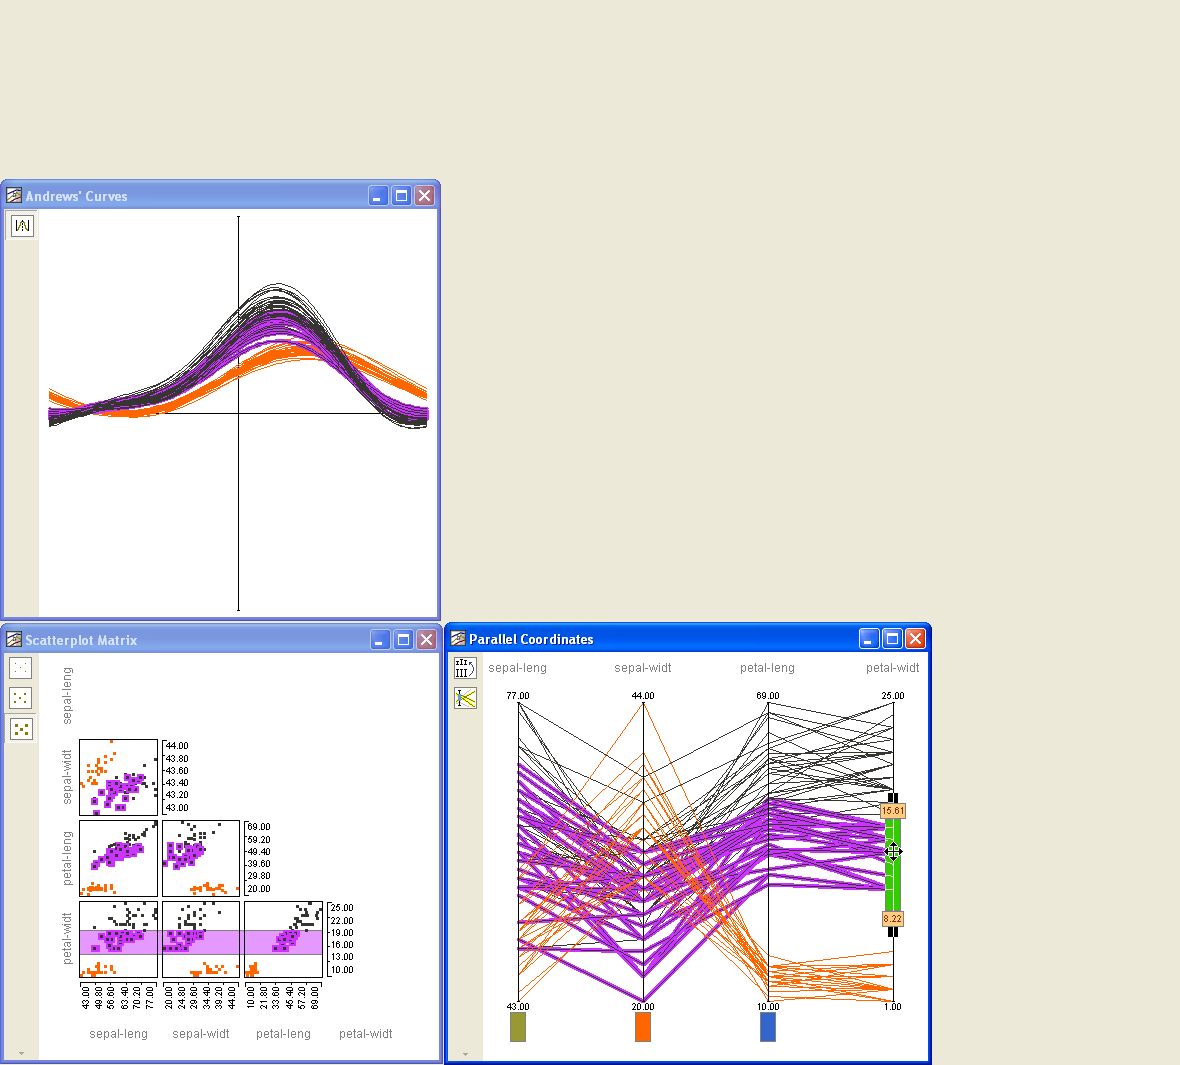
Visualise a common data set with different methods at the same time. Note how markings and selections appear in each view:


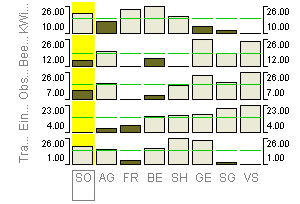
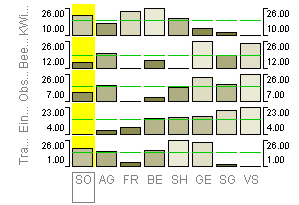
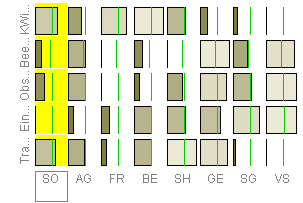
Shows some views of Permutation Matrices:

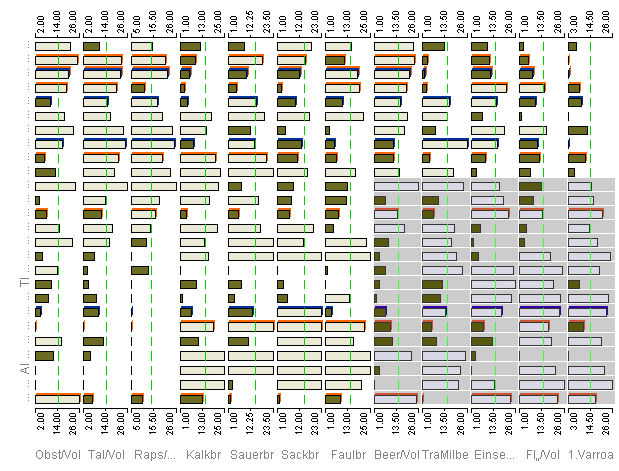
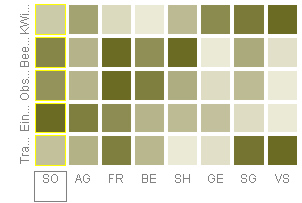
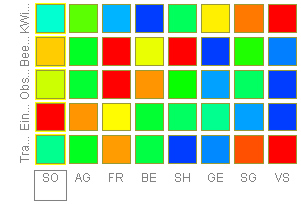
Shows the six different draw types of Permutation Matrices:

> Home |