|

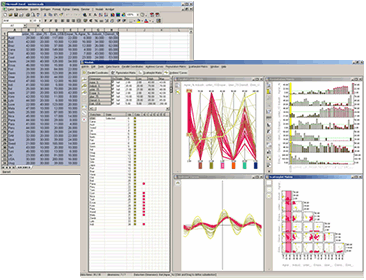
VisuLab (short for visualisation laboratory) is an experimental software package for the comparative visualisation of multivariate data.
"Comparative" means the possibility to show multivariate data in various display windows simultaneously, thereby using different visualisation methods. Under "multivariate data" we understand multidimensional data with many variable coordinates.
Data to be visualized must be available as a "CSV" file.
VisuLab is a registered trademark of the ETH Zurich
> Features |